

Due to the distributed nature of Sitecore commerce in a production environment, monitoring the performance of code across the entire application stack, especially post release, can be difficult.
This post explains how to integrate Stackify’s Retrace APM into the commerce engine (CE) so code performance can be monitored down to the individual class and method level.
In other words, we should be able to track application performance all the way from the requests to the content delivery server all the way through to the commerce engine and its individual pipelines and pipeline blocks.
This will allow you to see how the standard Sitecore Plugins and your custom plugins perform in a production environment.
As an added bonus you will be able to see how the underlying SQL operations perform within the commerce engine.
The question is “Why not use Azure Application Insights?”. App Insights is also a viable option, I will share a post on it and possibly New Relic pretty soon.
Stackify is really easy to get going, has a lower cost than other options and has a nice feature set for the lower cost.
This post covers the following :-
- Sign up for Stackify Retrace and create an environment.
- Installing the Stackify agent
- Adding the Stackify to the commerce engine and tracking code performance all the way from the reference storefront, all the way through to the commerce engine pipelines and blocks
Note: You can also send the logs from all your different apps\servers to Stackify so you have one unified view of all your logs. This is especially useful if you are not already running Application Insights.
Step 1 – Sign up
Go to https://stackify.com/ and sign up for a free trial. It will ask you to create an environment. Take note of the environment name, you will need it later. Also take note of your activation key.
Step 2 – Install the Stackify Agent
On each server you would like monitor, including the commerce engine Shops\Authoring instances and CD servers, install the Agent. Download the relevant agent here. You will need your activation key from step 1.
You can install the Stackify agent in PAAS or IAAS environments.
Stackify have a nice and simple “wizard’ish” type guide for helping you do this.

Once you have installed the agents on the various Servers and or Azure App Services, you will already start to see APM metrics for each component of the Sitecore Commerce stack.
Go to the Sitecore commerce SXA storefront, browse the site, add something to the shopping cart, complete an order etc. This will create some test traffic for you if you don’t have some already.
Note: As we have not installed the instrumentation into the commerce engine (Step 3) you wont get detailed code profiling of the individual pipelines and blocks just yet. Still some good stuff but not 100% there yet.
You can see the results of the monitoring by opening Stackify Retrace and going to Monitoring, then Apps. You should see all your apps that are installed on servers where the agent is running. Anything running in IIS is automatically included, so you see your CD\CM\CE sites as well as the xConnect sites.
Tip : You can also add Solr by using the “Add App” button.
For example…

Click on the CD site, for example “xp.sc”, then open the “APM+” tab. You should see something like the screenshot below detailing all the requests made and their performance.

Click one of the requests and it will show you all the detail of your request, including the SQL executed and the calls made to the commerce engine.

We can now go one step further by enabling the instrumentation in the commerce engine so we can track the request all the way down to the pipeline and block level.
Step 3 – Add Stackify to the CE
Note : This will only work if the engine is running in IIS or App Service i.e. this wont work if the engine is running in the console on a development environment.
Here we will add Stackify middleware to the commerce engine and filter the amount of code that is profiled. This is in order to limit the code profiling to the commerce plugins and filter out the noise of all the other code that is running that we may not be interested in.
Open your Sitecore commerce engine SDK solution, right click on the project “Sitecore.Commerce.Engine” and add the Stackify Middleware nuget package. The newer versions do not support the version of .Net core the commerce engine uses so you have to use 2.0.3 or below.
In the “Startup” class of the commerce engine, in the “Configure” method add the following line of code…
app.UseMiddleware<StackifyMiddleware.RequestTracerMiddleware>();
Should look like this…

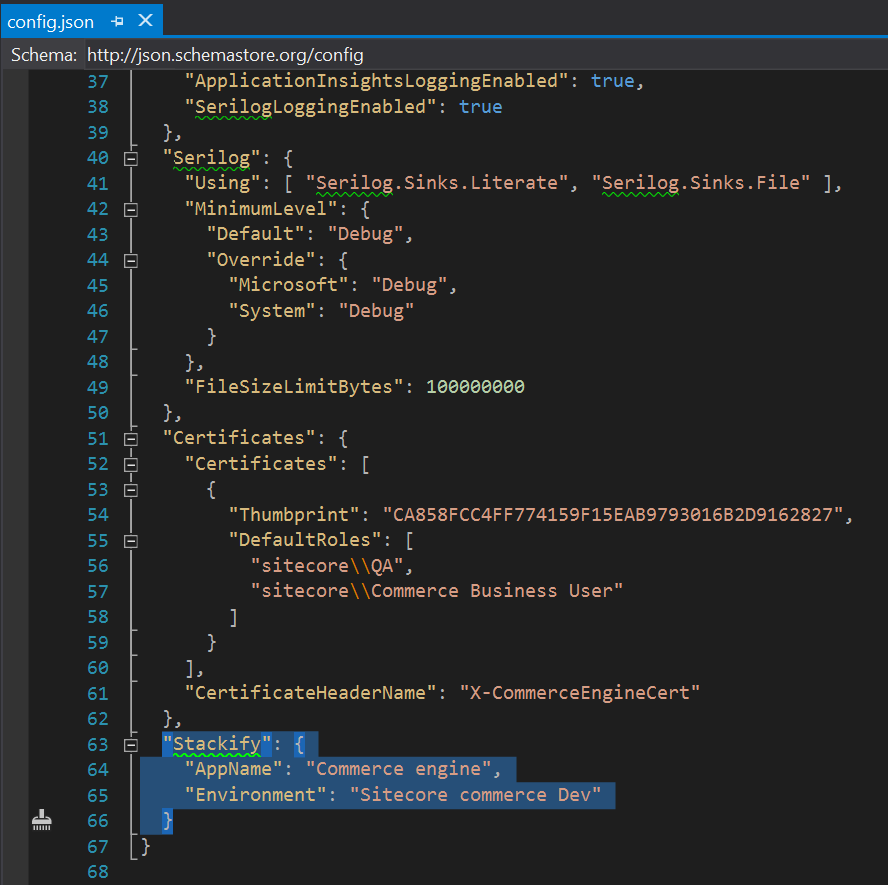
Add the following section to the config.json of the commerce engine…
“Stackify”: {
“AppName”: “Commerce engine”,
“Environment”: “[MY ENVIRONMENT NAME FROM STEP 1]”
}
Your config.json Should look something like this…
You can now build and deploy your code to an App Service or a VM instance with the agent running.
To filter out the noise from the code profiling so we only see commerce plugin code, browse to the directory where the Stackify agent is installed, for example “C:\Program Files (x86)\Stackify” and follow the instructions here.
Your “ProfileClientConfig.txt” should look like the example below, you can add filters for your custom plugins. Restart the app pool or app service after making these changes.
[{
"Class": "Sitecore.Commerce.Plugin.*", "Method": "*"
}]
You will need to restart the app pool of the engine in IIS or the App Service after making changes to the file above.
Once again browse the storefront and add lines to the cart, complete an order or search for products. Now when you go to the requests being made the relevant commerce engine you will be able to see the execution times of the individual pipelines and the blocks within the requests. In the screen shot below you can see all the blocks executed when the cart is retrieved and how long they took to execute.
Note: Make sure you select a request to CE that was done after you enabled the Stackify middleware other wise you will not see this level of detail.

